Energy savings and data collection and visualization
Early this year we finally have a (bought) home of our own, I’ve been working to be more sustainable with respect to energy efficiency in addition moving away from fossil fuels for our two cars. Being energy efficient is great because it’s both good for the environment, for your comfort and it’s financially lucrative, so there’s no reason NOT to do it.
Carbon footprint of solar power
Solar cells by themselves aren’t “clean”, but the positive effects are significant. So, we started with photovoltaic (PV) solar panels, 43 of them! The 6000+ Watt (peak) system easily generates 5100 kWh yearly. A coal-fired plant would emit 4,8 metric tons of CO2 to make the same amount of energy. To put that into perspective, if you would plant trees to sequester the same amount, you need to plant over 200 trees every year (and plant them without using energy). Obviously, while coal is a significant share of our power mix, it’s not 100%. But at least in our case we’re 100% sure that this power significantly cleaner.
The CO2 saved, converted to trees (just for perspective), I calculated as follows:
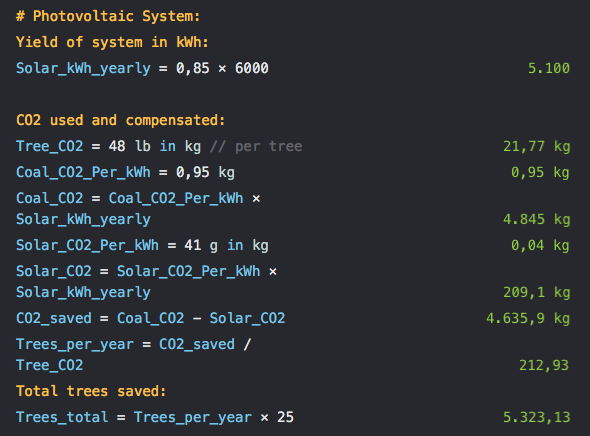
Calculated with Numi.io. Coal CO2 footprint per kWh from 1999 DOD data ( see http://bit.ly/2hqi3A2 )
The panels are bit smaller than the standard (~ 164 x 100 cm) panels that most people know, which makes it easier to put a lot of them on a roof. I planned the layout as follows:
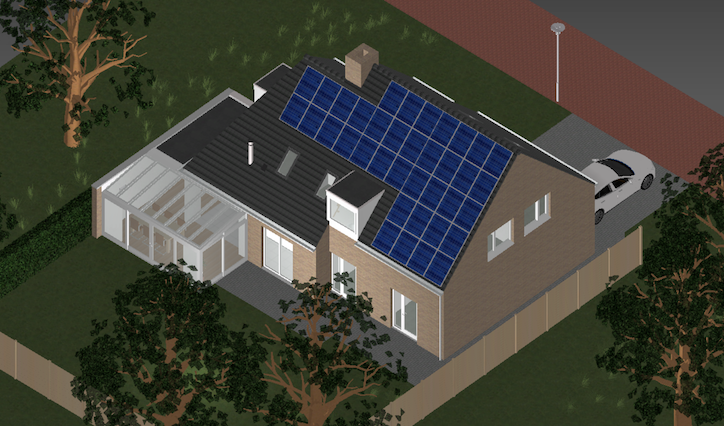
Planned solar panel layout
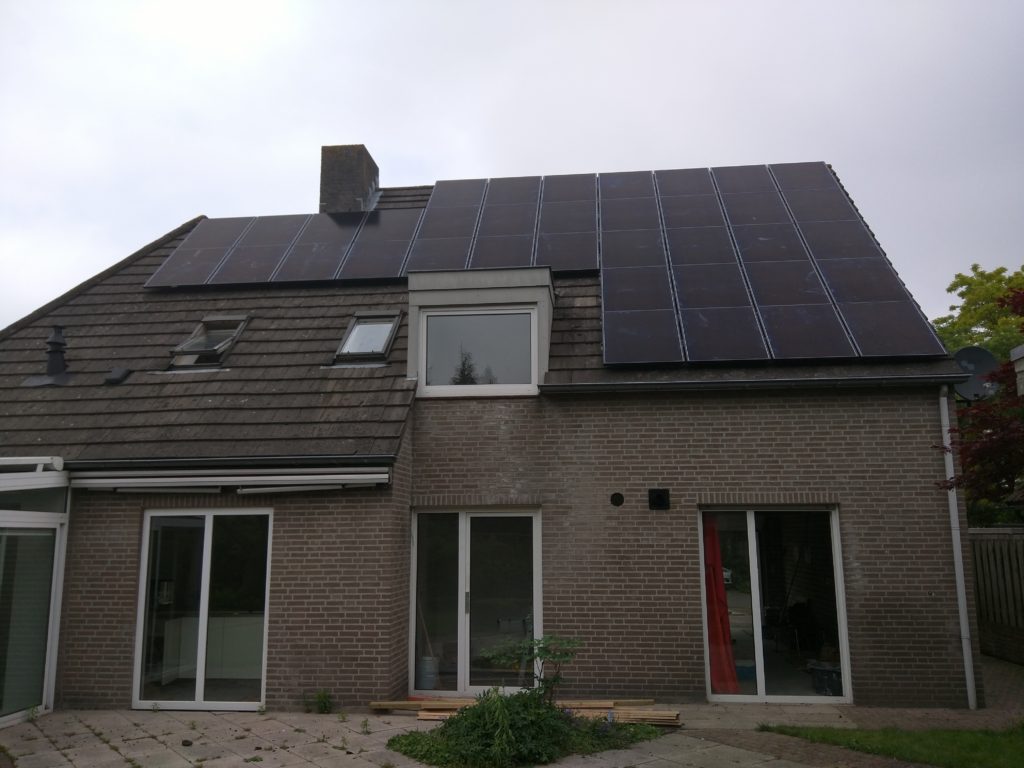
June 2, 2016, the PV-installation is generating power!
The panels we chose are of a special kind of “Thin Film” which uses certain metals that aren’t full of toxic chemicals such as Cadmium that will need to be recycled. These contain relatively harmless base elements: Cesium, Indium, Gallium and Selenium. With regular panels, a lot of energy and process water is waste during production. These thin film also use only a tiny fraction of the photoactive material that you’d find in a Cadmium based cell.
Home solar panels make economic sense…
…for a long time already. With a south facing roof the yield can be quite high, this makes the investment totally worth it, but even a west or east facing roofs generate significant revenue to justify it. Here you can find out the solar intensity you can expect over a year for the location where you live, given the orientation and slope of your roof. So you can already know how much money the panels will make. With current government regulation in the Netherlands you’re allowed to use power from the grid when you’re producing less and compensate this by producing more energy than you consume at other times. This allows me to earn back the investment in the entire installation in just 6,7 years. If this policy changes I could still buffer energy our Tesla Model S or Renault Zoë, if one of them is connected up. E.g. only charge the electric car when the sun shines.
What most people don’t know, is that it’s almost always possible to include solar panels in a mortgage. This is because banks know for sure that with the investment, you’ll be more easily able to make ends meet. This is because your utility costs are more than compensated by the investment even if you account for the higher mortgage down payments. Also, there are green loans for such investments if want a simple loan instead of changing your mortgage (E.g. SVn offers this in the Netherlands.).
Being smart with natural gas
The other thing we did was adding a smart thermostat that knows when we’re at home and away. We opted for the Nest because Google knows pretty much everything about our behavior and w.r.t. potential energy savings, that’s a good thing. I first had to upgrade our central heating system to support OpenTherm, because it only supported a proprietary Nefit protocol that only works with the Nefit supplied smart thermostat.
Now I’m looking into a heat pump to use electricity to move thermal energy from outside into our home heating system. This means that less fossil fuel is needed (natural gas, in this case). Such a system can draw for instance 4 kW of heat into your home using only 1 kW of electrical energy.
Usually, insulation is even more cost-effective. So, I first want to know the R-constant which determines how much heat my home loses given the delta T (difference between inside and outside temperature). I can calculate it if I know the gas consumption, caloric value of the gas and the delta T.
Understanding our gas consumption for heating
But to make good choices you need data! I already have electrical power consumption and generation metrics that are logged and graphed. But I was missing my natural gas consumption to understand the Nest’s behavior and know the baseline usage of natural gas before I start optimizing.
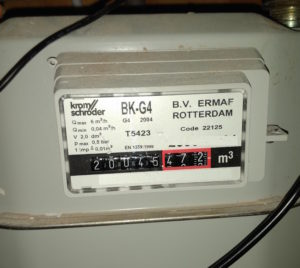
Our G4 gas meter
Electronics
I’ve built a gas-usage sensor based on a reed switch (a fancy word for a switch that is activated by a magnet). Reed switches are often used to sense if a door is open/closed e.g. in security alarm sensors. In this case after Googling a bit, there was already a magnet in my gas meter. If the gas meter rotates its third decimal digit (the 8 in 20142.328) by whole revolution, this equals 0.01 m³ of gas and the switch closes until it rotates a bit further. I hooked that reed switch up to a Pi’s GPIOs and read it with a simple Python script that pushes the data into Graphite.
Data collection
I settled on Graphite, since I have some experience with RRDTool in the past. The concept of an RRD (Round Robin Database) is very cool. The database essentially never “grows” in size over time, you allocate an amount of storage to get the temporal resolution you want. Since you want to know more details of recent events (e.g. energy use in recent days), but this data can be aggregated when it’s “older”. A lower resolution is suitable for data concerning long time trends. Another benefit is that such a system doesn’t get slower over time.
Graphite is a really nice (RRD based) time series collection framework. It can handle huge amounts of metrics and data points without becoming slower or use an increasing amount of storage as time passes. This is because it uses and Round Robin Database.
Collection agent
I’m running both the data collection agent and Graphite on the same host (a Raspberry Pi 2) for practical reasons, but they could run on different systems just as well. Graphite can accept data from all kinds of sources. I decided on the most simple solution in Python (already present on Raspbian Lite on the Pi):
sock = socket.socket()
sock.connect( (“localhost”, 2003) )
sock.send(“meters.gasM3 20145.42 %d \n” % time.time())
The data then becomes “graphable”. You can get graphs straight out of Graphite of use fancy visualization & dashboarding apps like Grafana. I went for simple graphs first because I was to curious about the data. The first result is a simple HTML page that combines a few images (svg graphs) dynamically generated by Graphite (green arrows and text are my additions):
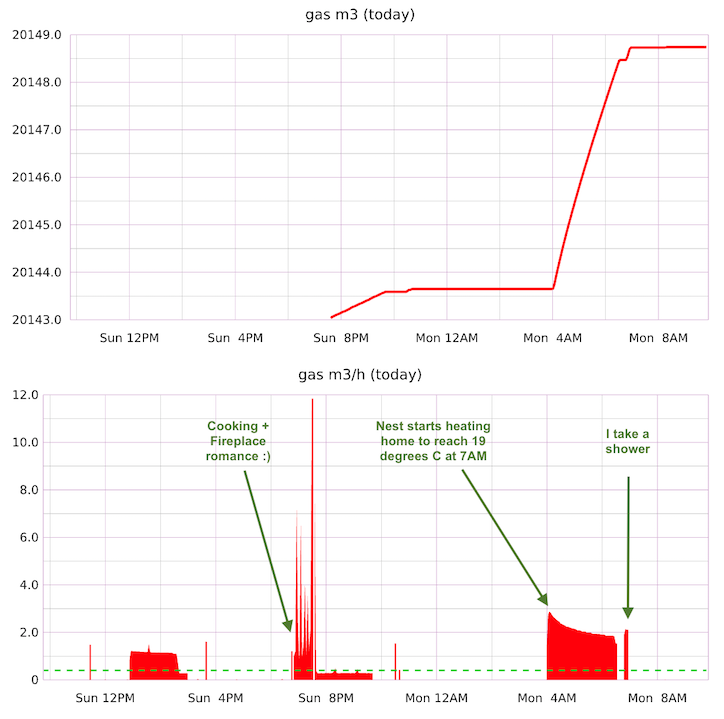
My basic dashboard. Green remars are added later. Dashed green line is average use over the displayed 24h
Things that I noticed:
- I wasn’t entirely happy with how my Nest started heating our home fairly late. It would not even reach the set point in time to meet the schedule. Kind of the purpose of a smart thermostat. Now I can finally see at what time it actually starts heating.
- Now that I can visualize the data, I can see that Nest sets heating to a high duty-cycle at night when there is no urgency at all. This is much less efficient than just heating “mildly” and starting a bit sooner.
- I want to see the indoor temperature response in the same graph! More to be done 🙂
Graphing data like this started as this “weekend” project, but this is likely to go on. I’d like to add more metrics to the system, e.g. electrical power usage and generation, temperatures in my home, outside climate conditions, wind speed, etc. Hopefully I’ll find the time to share some more details in future blog posts!
Recente reacties